Showing posts with label evaluation. Show all posts

Wednesday, February 28, 2018

Growing Environmental Public Health Challenges

Megan Hatch, MPH 
Research Associate 


Environmental public health covers a vast area, from the air humans breathe to the way industrialization effects the communities we live in and the food we eat. There are two branches that are particularly of growing concern to Massachusetts however: rising temperatures and water levels.  As an organization committed to public and community health, the Institute for Community Health (ICH) is concerned about the damages occurring because of climate change.  Some of these issues are described below.

Rising Temperatures:
Massachusetts has seen some warm temperatures during the recent winter. While some might enjoy these warmer temperatures, the warmth can support disease transmission, particularly of Lyme disease. When winter temperatures are warm, fewer ticks die, resulting in more ticks alive to carry Lyme disease and transmit it to humans1. Massachusetts is already a hotbed for ticks, with 4518 confirmed and probable cases of Lyme reported in MA in 20162. Lyme disease can cause significant morbidity in life, including fatigue, swollen joints, and even cognitive decline3. Lyme has been a public health issue for decades, and an increase in temperatures should cause states to re-evaluate the type of educational programs and screening mechanisms that are currently in use. 

Along with expanded timeframes for vectors to spread disease, rising temperatures can also give way to heat waves, which increase the incidence of heat stroke. Heat stroke is a condition characterized by the body’s inability to regulate its own temperature4. Cities have seen rises in death rates during heat waves in the past few years4. Cities are in a unique position during heatwaves, as they are hotter than surrounding rural areas, due to the Urban Heat Island Effect5. The danger of heat in cities has caused some, such as Chicago, to implement targeted outreach to vulnerable neighborhoods, as a preventative measure before heatwaves6.


 Water Levels:
Water is another facet of environmental public health that is of concern. Access to water due to droughts is a growing problem across the world7, and so is flooding due to sea level rise. Massachusetts is in a bit of a precarious position when it comes to flooding, a 2016 study predicted8. Due to a combination of gravitational pull on the ocean, South Pole ice melt, and sinking of the Northeast, East Coast cities could have a 25% higher increase in sea level than other areas of the planet8. Flooding due to seawater rise, but also heavy downpours, can be vehicles for waterborne illnesses, such as cryptosporidiosis and campylobacteriosis, among many others9.
The danger is not over once floodwaters recede or heavy rainfalls stop, however. The water-soaked items left in floodwater’s wake are perfect for growing mold and harboring other bacteria that can make humans sick. A study done after in New Orleans after Hurricane Katrina looked at asthma rates in children. While mold is commonly a trigger for asthma and a concern after water damage, the study also considered stress after a traumatizing event as a trigger for asthmatic children10. This crossover from strictly environmental factors such as bacteria, viruses, and mold, to behavioral risk factors (stress), caused by environmental factors like flooding, highlights that public health does not exist in a vacuum and all parts of human health can be influenced by environmental public health. Large swaths of the greater Boston area (including Malden, Cambridge, Revere, Chelsea, and Winthrop) are all in the predicted flood zone of the below model11. The position of these communities means public health agencies should look into needs assessments, and public health prevention efforts, to be prepared should a flood ever occur. Boston and Revere have already seen a taste of coastal flooding in January, due to Winter Storm Grayson12
*2050 sea level rise + Major storm. Boston could experience 7 feet of flooding (2 feet of sea level rise + 5 feet of storm surge = 7 feet of flooding). Data from http://seachange.sasaki.com

As mentioned before, the various sections of public health do not occur in a vacuum. In 2015, Researchers published their findings that refugees (due to civil war or other conflicts) experience health disparities at a greater rate than other populations13. On the horizon is a new type of refugee: climate refugees, people who have been forced out of their homes by environmental factors. Like other refugees, they will face barriers to health equity, and the field of public health will need to add resources to addressing these challenges.
For all public health issues mentioned above, it is important to note that children, communities of color, and low-income communities are usually more heavily affected than other demographics.
Need for evaluation, research and assessment:
            As public health departments, cities, towns, and hospitals encounter these new challenges caused by environmental factors, they will need to undertake needs assessments to inform the type of programs that would benefit their populations. Additionally, once programs are in place, they will need to be evaluated to ensure they are meeting the population’s needs, and to seek out areas of improvement. ICH has worked with local public health departments, the Massachusetts Department of Public Health, and hospitals in the past, working with a variety of data, from medical records claims, to the YBRS for social behavioral risk factors for health. As such, ICH’s previous work puts us in an excellent position to help other public health agencies plan, evaluate, and improve programs to reach their climate-change preparedness goals. 

Sources:


Tuesday, January 16, 2018

What is being done about the opioid epidemic at a national, state, and local level


Elaine Zhang, BS
Research Associate 

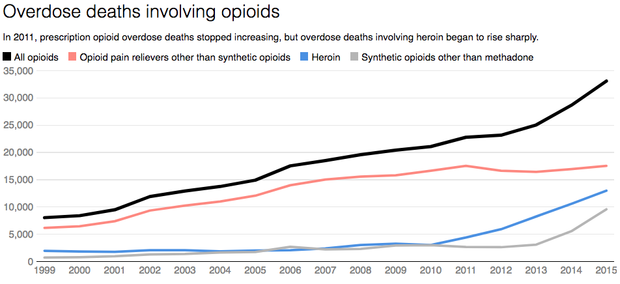
The rise in pain killer prescriptions from doctors combined with aggressive marketing campaigns from large pharmaceutical companies in the 1990’s awakened a tsunami of addiction that has swept through the US resulting in significant increase in opioid drug overdose death rates. From 2000 to 2015 more than half a million people died from a drug overdose.1  Since 2011, the rate of drug overdose deaths due to opioid prescriptions started to level out while death rate due to heroin overdose experienced a sharp increase, see graph below. In 2016, roughly 64,000 people died due to drug overdoses making it the leading cause of death for Americans under 50 years old.2

Massachusetts is experiencing the opioid epidemic at a much higher rate than the rest of US. In 2014, Massachusetts’s age adjusted overdose death rate was 23.3 per 100,000 which is more than doubled the national rate of 9.6 per 100,0003. In 2017, there were 932 confirmed opioid related deaths in Massachusetts; 76% of deaths were male and 24% were female.4 The opioid epidemic also affects the white non-Hispanic population at a much higher rate than any other race. Of the 932 confirmed opioid-related deaths in 2017, 81% or 753 of those deaths were of people of white non-Hispanic race/ethnicity. This group has historically had higher death rates than any other race/ethnic group in the past three years4, see graph below. 

At a county level, certain counties are experiencing higher opioid overdose death rates than other ones. Barnstable, Berkshire, Bristol, Duke, Essex, Norfolk, Plymouth, and Worcester counties currently have the highest opioid overdose death rate,5 see map below. 


In October 2017, the president declared the opioid epidemic a national public health emergency. The Department of Health and Human Services has outlined a five-point strategy to combat the opioid epidemic:
1.       Improving access to treatment and recovery services
2.       Promoting use of overdose reversing drugs
3.       Strengthening our understanding of the epidemic through better public health surveillance
4.       Providing support for cutting edge research on pain and addiction
5.       Advancing better practices for pain management.
The Center for Disease Control and Prevention (CDC) awarded $28.6 million in funds to 44 states and the District of Columbia to help strengthen prevention efforts and better understand the epidemic through public health data6, which aligns with part of the HHS five point strategy.

In 2015, Massachusetts Governor Charlie Baker signed Chapter 55 into law in response to the opioid epidemic. The new law allowed different government data sets to be analyzed to help guide policy decisions and better understand the opioid epidemic.7 The Baker administration also allocated $34.5 million to combat the opioid epidemic through raising awareness, increasing prevention, and providing education. Recent data shows that in the first 9 months of 2017 there were 167 fewer opioid related overdose deaths when compared to the first 9 months of 2016, a 10% drop in deaths.8 Along with the decrease in deaths, there has also been a 30% decrease in the number of patients who were prescribed an opioid in the third quarter of 2017 when compared to the first quarter of 2015.8

At ICH, we work on several projects that focus on the opioid substance use disorders. SUSTAIN Communities Evaluation is an initiative funded by the GE Foundation with support from Partners HealthCare. SUSTAIN Communities provide grants and technical assistance to community health centers to build capacity for Medication Assisted Treatment (MAT) for patients with opioid use disorder.  ICH Assistant Director of Research, Leah Zallman, MD, MPH, works on a project funded by a small foundation (McManus) that uses electronic health record data to understand the relationship between opioid prescriptions and the development of opioid abuse disorder. ICH is looking into Cambridge Health Alliance data among patients who have ever been prescribed opioids and tracking how many developed opioid use disorders, how long it took, and what are the clinical predictors. Promoting Older Women’s Engagement in Recovery (POWER) is a collaborative project aimed at the prevention of opioid misuse in older women ages 55 or older in Cambridge and Somerville. The Institute for Health and Recovery received the grant and works alongside with Cambridge Health Alliance, Somerville Cambridge Elder Services, and the Cambridge Council on Aging to address the risk factors of opioid misuse among older women through technical assistance for partnership sites and direct support groups for women 55+. ICH is the evaluator on the project.

If you or someone you know is struggling with addition, there are some resources available to help. The Massachusetts SubstanceAbuse Information and Education Helpline provides free and confidential information and referrals for alcohol and other drug abuse problems. The Institute for Health and Recovery helps families and youth with substance abuse issues access publicly funded services. The Suboxone Hotline Office Based Opioid Treatment Program at Boston Medical Center provides referrals and information on opiate and heroin treatments available at doctor’s offices statewide. Cambridge Health Alliance offers an outpatient addiction service which helps adults to and maintain sobriety. The Fresh Start Alcohol and Drug Recovery Group is an anonymous peer support group that meets on Thursday evenings at CHA Revere Care Center. Smart Recovery is a scientifically tested program for adults who want to manage their addiction and is held every Tuesday evening at CHA Everett Care Center.

Below are the numbers for each helpline:
The Massachusetts Substance Abuse Information and Education Helpline:
Phone Toll Free: 1-800-327-5050
TTY: 1-888-448-8321

The Institute for Health and Recovery:
Phone: 1-866-705-2807
TTY: 1-617-661-9051

Suboxone Hotline Office Based Opioid Treatment Program at BMC:
Phone: 1-866-414-6926 or 1-617-414-6926


Sources:

Tuesday, June 10, 2014

Using Creative Methods to Evaluate Youth Programs

By Kelly Washburn & Julie Carpineto 


We are the evaluators of an urban high school-based teen pregnancy prevention program in Everett, MA called “Empowering Youth in our Community”. Our partner, whom ICH has worked with for 9 years, is the Family Planning and Adolescent Community Services Division at the Cambridge Health Alliance.  

Each year, the program is required to conduct a site-specific evaluation. In previous years, we conducted focus groups with the high school students involved in the program to meet this requirement. However, two years ago - while reviewing the qualitative data from those groups - we realized the data was not that different than previous years. This realization led to discussions on how to conduct an evaluation to find new information, while continuing to ensure that the students could play an active, participatory role.  Together with the program partners, we developed a three-series collage project, drawing from the principles of Photovoice and other arts-based evaluation techniques. We aimed to engage participants in a discussion of a major theme addressed in the program: healthy relationships.

Developing the Evaluation Question
The first step in our process was to determine our evaluation question. We collaborated with the program coordinator to come up with “What does a healthy relationship look like to you?”  This question was chosen for a couple of reasons, the first being the timing of the evaluation with the program sessions. Students had recently completed a series of classroom sessions focused on healthy and unhealthy relationships, and we were interested in understanding how those sessions shaped their vision of healthy relationships. Furthermore, data from focus groups conducted in previous years revealed that the relationship sessions stuck out to students and had the most impact on them personally.  By asking this question, we were able to gain a more in-depth understanding of students’ opinions about this topic.

Collage Implementation
Over 90 high school students, in five separate classes, were asked to individually pull images from popular magazines that, from their perspective, represented healthy relationships. We left the type of relationship up to the individual students to think about, and many discussed a combination of romantic, friend, and family relationships. They were then led in large group discussions about why they chose their images.  Looking at their chosen images, students were asked to reflect on their thoughts, feelings, perceptions and experiences related to the different types of relationships. 

Afterwards, students were asked to work in small groups to combine their images to form a larger, collective collage poster. These posters served as visual representations of the students’ perceptions of healthy relationships.

Next Steps
The final phase of this project will include individual interviews with participating students to gather additional information about the collage process and their overall experience as program participants.

Lessons Learned:  
  • Magazine selection should be a part of initial planning. Examples of the magazines we used included: Glamour, People Magazine, Sports Illustrated, and Marie Claire.
  • Chose a diverse range of magazines. Make sure your selection of images is representative of your population!

Hot tip:
  • This project can be done with a small budget, limited time and with almost any participant population.
  • This project is a fun and creative way to engage young people in evaluation.

Cool Trick:
  •  If available, take notes from the large discussion on a white board. This serves as another visual representation and can help students develop their collages.  


ICH staff have expertise in a variety of program evaluation methods and strive to tailor each evaluation to meet the needs of individual clients and programs. Learn more about ICH's Program Evaluation services.


  ---------------------------------------------------------------------------------------------------------------------------------------
The views expressed on the Institute for Community Health blog page are solely those of the blog post author(s), and do not necessarily reflect the views of ICH, the author’s employer or other organizations with which the author is associated.

Thursday, October 17, 2013

Trauma Services for Children & Families: Lessons Learned from Program Evaluation

By Molly Ryan, MPH

This month several Institute for Community Health staffers will showcase our program evaluation work at the American Evaluation Association Annual Conference. Participatory program evaluation is central to the ICH mission and is one of our core services.  In honor of AEA and National Depression Screening Day, we’re highlighting our work evaluating mental health services with the Central Massachusetts Child Trauma Center (CMCTC).

ICH has partnered with CMCTC for the past year to evaluate their delivery of evidence-based, trauma-informed mental health services for children and adolescents, particularly those with a military affiliation. ICH and CMCTC project staff utilize standardized trauma evaluation tools to measure trauma exposures and symptoms, resulting behaviors, and caregiver strain. Mental health providers administer the tools, which are then sent to ICH for immediate analysis. This immediate analysis provides mental health clinicians, patients, and families with data in “real time”, allowing providers to efficiently modify the care plan and help validate patients and families’ experiences of trauma. Our periodic aggregate review of clinical assessment data also helps the project directors understand the strengths and limitations of the treatments, informs training improvements, and ultimately contributes to the treatment models’ evidence base.

As we enter our second year of evaluation, we’re reflecting on some of the key lessons learned:

Training
  • Just because a tool is standardized does not mean it’s easy to follow! In order to ensure data reliability, it’s important for providers to be trained users of the tools and for them to help clients complete the tools.
  • Evaluators must ensure that clinicians are comfortable using the evaluation tools in the clinical encounter.
    • Tip: Use a combination of text and graphics to explain evaluation results. This will help both providers and caregivers understand the data.


  • When using multiple data collection tools at multiple time points, help providers keep track of upcoming due dates. This is particularly important if providers have several clients enrolled in the evaluation.
    • Tip: Remind providers when a client’s follow-up assessment is approaching. Time the reminder so that clinicians have enough scheduling flexibility to complete the assessment.  Several reminders may also be necessary.
    • Tip: Create schematics like the one below to help providers understand when to complete evaluation tools.


Retention
  • It’s important to recognize that it can be difficult for vulnerable populations, such as individuals receiving trauma services, to remain in care. Unstable living situations, acute mental health problems, and readiness for treatment are just a few of the issues that our program population frequently endure. As a result, “lost to follow up” is a common issue for program evaluation.
    • Tip: Maintain open lines of communication with providers in order to track clients’ progress and create a tracking mechanism to document clients’ change in status.
    • Tip: Anticipate that clients are more likely to drop out of treatment in the first 3 months. Work with program staff to identify the information that is essential and meaningful to capture if a client has not been actively engaged in treatment.

Meaningful evaluation of mental health services depends on effective and efficient collaboration between project leaders, clinicians, and evaluators.  Our experience with this evaluation highlights the value of multi-disciplinary partnerships to improve mental health outcomes for children and their families. 

   ---------------------------------------------------------------------------------------------------------------------------------------
The views expressed on the Institute for Community Health blog page are solely those of the blog post author(s), and do not necessarily reflect the views of ICH, the author’s employer or other organizations with which the author is associated.


Wednesday, August 28, 2013

What do these findings mean and how do I communicate them?

Tips and Tricks for Interpreting and Reporting Qualitative Data

Part 4 in a 4 part series

By Julie Carpineto, MFA & Eileen Dryden, PhD


Once qualitative data has been collected, coded and analyzed, it needs to be interpreted and packaged in a way that is meaningful to stakeholders.  Interpreting and communicating qualitative findings is essential for ensuring the results will be used – and this, really, is the ultimate goal!  Here are some tips and tricks for interpreting and reporting qualitative data.

Data Interpretation

Tip:  Begin by listing key points and themes:
  • What have your qualitative findings confirmed? This is especially important to consider if your qualitative research was part of a mixed-methods effort to learn more about a particular topic, community problem, etc.
  • What are the major lessons learned?
  • What, if anything, can be applied to other settings, programs, or studies?
 
Tip: Establish criteria for deciding what is considered a “major” or “common” theme.
  • A theme will usually be considered “major” or “common,” and therefore worth reporting or highlighting, if noted by at least 50% of a group or subgroup.
  •  As appropriate, think about meaningful ways to categorize your themes (e.g. “suggestions for improvement”)
  • Depending on your research question, it may also be important to note minor themes or the absence of an expected theme.

Tip:  Stakeholders (e.g. program staff, participants, community members) can provide valuable insight into qualitative findings! Work closely with stakeholders to review findings and determine their significance and relative importance. 

Data Reporting

Tip: Consider your audience(s) and determine the best report format and venue for communicating with them effectively.  Sometimes the best report is not a report at all!  Posters, videos, brochures, slide shows and oral presentations are all great options. Be creative!


Tip: If you do create a more traditional report, keep in mind that, in general, less is more. Again, consider your  audience(s) and stakeholders when determining appropriate report length.
 
Trick: Create an executive summary (‘1-pager’) that highlights main findings (qualitative reports can get very long!)


Tip: Use quotes and photos to illustrate themes throughout your report (whatever the format!).

Tip: Make the most of all the work you have done.  Qualitative findings can have multiple uses – think sustainability!  Compelling quotes and photos can be used for marketing initiatives, funding proposals, etc…

We’ve come to the end of this 4-part “Tips and Tricks” series for using qualitative methods.  While not all of these tips and tricks are appropriate for all your qualitative endeavors, we hope this series has given you a flavor of qualitative methods and encourages you to consider using them in your next research or evaluation project.

If you are interested in reading more about qualitative methods, there is a treasure trove of available books on the topic. One we highly recommend is Michael Quinn Patton’s book, “Qualitative Evaluation and Research Methods”, SAGE Publications, Inc: 3rd edition (October 2001). It is a great end-of-summer page-turner!

Please see our Qualitative Methods page for more information on ICH’s qualitative methods approach & expertise.

------------------------------------------------------------------------------------------------------------
The views expressed on the Institute for Community Health blog page are solely those of the blog post author(s), and do not necessarily reflect the views of ICH, the author’s employer or other organizations with which the author is associated.

Wednesday, August 21, 2013

I have such interesting qualitative data! Now how do I analyze it?

Tips and Tricks for Qualitative Data Analysis (Part 3 in a 4 part series)

By Julie Carpineto, MFA & Eileen Dryden, PhD


Qualitative data analysis and reporting can seem like a mysterious process for those new to it – but  it doesn’t have to be.  Here are some tips and tricks to help you simplify the process of analyzing qualitative data. 

Getting to Know your Data: Focusing and Starting Your Analysis

Tip: Start thinking about your analysis from the moment you begin data collection! Reflect on and record themes, theories, and areas of interest throughout the data collection process.
  • Trick: Schedule an extra ½ hour after focus groups for the facilitator, note taker and any other assistants to document preliminary themes, areas of interest and great quotes.

Tip:  Decide how you will approach your analysis based on your resources and with the research goals in mind.  Consider:
  • What resources do you have? (personnel, time, money, skills)
  • What level of detail and rigor do the people who will use the information need?     
 
Tip: Get to know your data by reading over notes and transcripts to assess the data’s quality, breadth and variability
  • Trick:  Again, document preliminary thoughts on main themes and points of interest.

Tip: Focus, focus, focus!! 
  • Trick: Keep your questions of interest at the forefront during all phases of your analysis and create a list of interesting ‘asides’ elsewhere that you may want to look into further at a later date. 
        Review the reasons you wanted to collect qualitative data
        Identify key questions you hope to answer or learn more about
 
Into the Thick of It: Developing a Codebook & Coding Your Data

After all your data is collected and you’ve identified some preliminary themes, the next step is to categorize your data into key themes, called “codes”.

To help organize this process, develop a “codebook” – or list of key themes – as a guide. This is essential for maintaining consistency if more than one analyst is coding, but can also be helpful for internal consistency and reporting transparency even if only one analyst is involved. Note: Your codebook will likely undergo changes. Emergent interests and insights may lead to adding or changing codes as you proceed.

Once you have developed a codebook, you can then start “coding” your data by labeling segments of text with the applicable themes/codes.


Tip: Use the focus group/interview guide to develop a preliminary codebook:
  • What do you think are the biggest strengths in your community?
    • Include the code “strengths"

  • How do you think the intervention could leverage these strengths to increase its likelihood of success?
    • Include the code “leveraging strengths”
  • Can you think of other key players—organizations, agencies, individuals, etc.—who could help increase the intervention’s likelihood of success?
    • Include the code “key players”
 
Tip: Have more than one person involved in analysis when possible. This increases reliability of findings.
o   Trick: Meet to review analysis periodically and resolve discrepancies in opinion.

Tip: Don’t rely on qualitative data analysis software to do the analysis for you. These software programs facilitate the analytical process by helping you manage large amounts of data – but you still have to do the analysis!
o   Trick: For smaller amounts of data you may find it’s easier to code ‘by-hand.’ When coding by hand, it can be helpful to use colors in MSWord or add extra code columns to MSExcel templates: for example:

How are you and your family getting along?
Code
What are you doing differently since the program?
Code
Yes I am more patient
Skill
Yes my son is talking to me
and working on family therapy.
Comm., Ther
I feel better about myself
Conf
I listen more and calmed down to try to take more time for myself.
Li, Skill, SN
Same most of the time
NC
First I sit down with my kids than we talked about problems how to get rid of it
Comm.
Yes , not so different from their past and present
MISC
Not really
NC
I am happier so yes!
Feel pos
Meditate take space look @ problems vs solutions instead of just problems
SN, Skill
My husband and I are doing much better Its helpful to have the time without a child to reflect on parenting and on our own issues goals and needs
Sp, Rel, Intro, SN
think about son's perspective and the values we want to convey instead of focusing just on good behavior. For example, think about how to model respect for others in daily behavior.
Skill


Tip: Take analysis up a level: summarize categories about a topic or question.
o   Trick: Note what is interesting/relevant (e.g. variability within and across groups; relative strength/commonality of themes). This will help you determine what is worth reporting on, or highlighting in your reports.
 
These are just a few ideas for focusing and implementing your analysis.  There are many ways to approach qualitative data analysis and some really great resources for learning more. One book we particularly recommend is "Qualitative Data Analysis: An Expanded Sourcebook", 2nd ed. by M. Huberman and M.B. Miles, Sage Publications, 1994.

Now you’re ready for the final phase in this journey with qualitative data: interpreting your findings and communicating them to stakeholders.  Look out for our fourth and final blog in this series for tips and tricks on qualitative data reporting!

For more information about the Institute for Community Health, please visit our website http://icommunityhealth.org/. Examples of our work and collaborations involving qualitative research are described here.

Note: different projects require different methodological approaches. This is not an exhaustive list of qualitative analysis techniques. You may find other techniques fit your project’s aims more effectively and appropriately.


 ------------------------------------------------------------------------------------------------------------
The views expressed on the Institute for Community Health blog page are solely those of the blog post author(s), and do not necessarily reflect the views of ICH, the author’s employer or other organizations with which the author is associated.